


 43 / 47

44
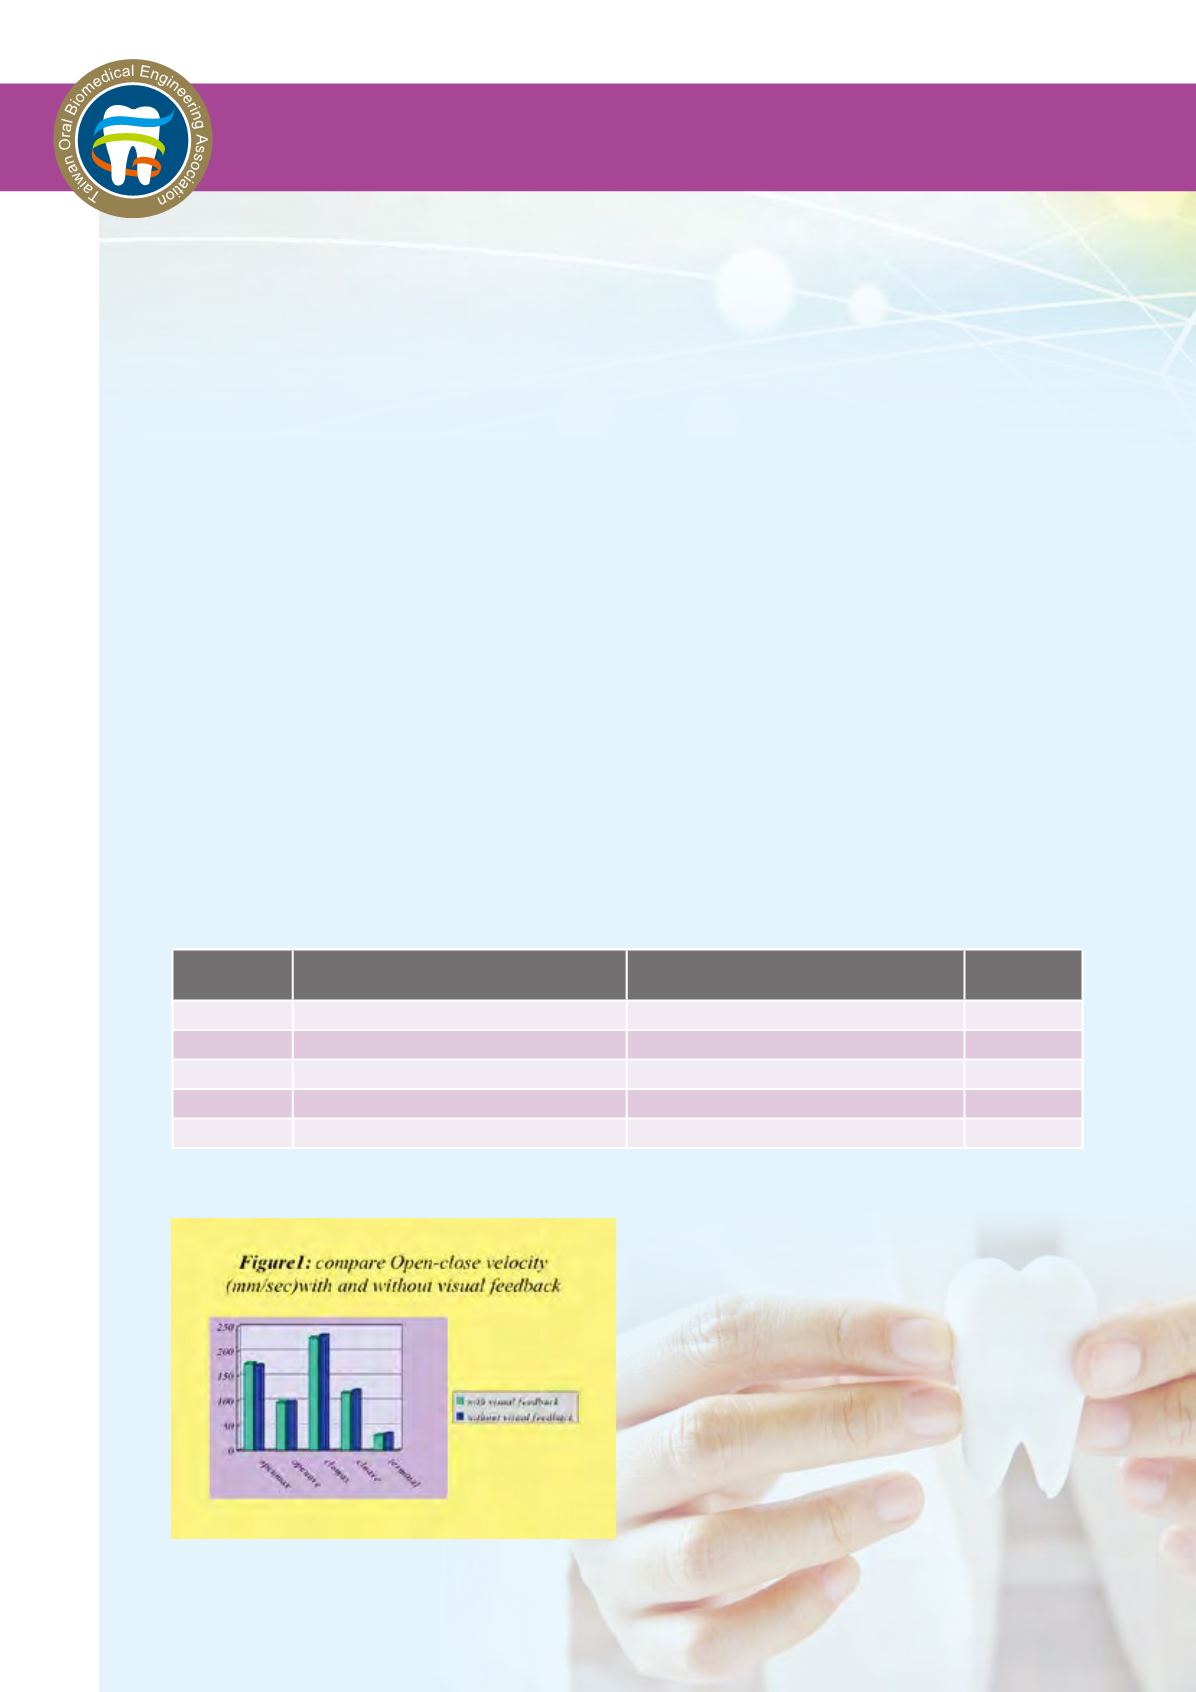
the average velocity of opening phase
i s 171 . 47mm/ sec and 97 . 10mm/ sec
respectively, while these of closing phase
i s 232 . 21mm/ sec and 121 . 21mm/ sec
respectively. The terminal contact velocity of
this study is 33.69mm/sec.
In figure 1, we noted that not only the
maximum closing velocity is faster than
opening velocity but also the average velocity
of closing phase. Data was analyzed by pair
t-test. There were no statistically significant
difference (P>0.05) between these two
groups. Neither the opening nor the closing
phase of mandibular movement was affected
by visual feedback.
Discussion
Visual feedback influences the mastication
muscle balance significantly, Dr. Lobbezoo
demanded all subjects to look at the monitor
in order to sure the factor of visual cues.
When visual feedback was obtained from the
masseter muscles, a decrease in the anterior
temporalis EMG activity was observed.
When visual feedback was obtained from the
anterior temporalis muscles, the activity of
the masseter muscles was raised.
When visual feedback was obtained from
both groups of muscles, the masseteric
Table 3:
Mean Velocity change with and without visual feedback
Base Data (mm/sec)
Mean S.D
Without visual feedback (mm/sec)
Mean S.D.
P value
Opmax
175.73 12.798
171.47 62.33
0.4418*
Opave
97.13 6.193
97.10 28.46
0.9711*
Clomax
227.29 13.459
232.21 43.81
0.6854*
Cloave
116.31 6.888
121.21 30.34
0.3368*
Terminal
31.20 3.723
33.69 18.94
0.3798*
*: P>0.05
Figure 1.
Open –close velocity difference in (mm/sec)
With visual feedback vs. without visual feedback
臺灣口腔醫學工程學會會誌
No.
13
Taiwan Oral